

Price to earnings ratio is one of the most widely used stock valuation metrics because it answers a simple question: how much are investors paying today for one dollar of a company’s earnings? In plain terms, the P/E ratio compares a company’s share price to its earnings per share (EPS).
Investors use this ratio to judge whether a stock looks expensive, cheap, or fairly valued compared to its own history, competitors, or the broader market. Despite its simplicity, misunderstanding the P/E ratio is one of the most common mistakes new investors make.
Here’s the problem. Many investors rely on the P/E ratio without knowing what it really measures, how it’s calculated, or when it stops being useful. That leads to poor stock picks, missed opportunities, or buying into hype.
This guide breaks down the P/E ratio meaning step by step, shows how to calculate P/E ratio correctly, and explains how real investors use it with actual market examples. You’ll also learn where it fails and how professionals adjust for those gaps.
Snippet-ready definition: The price to earnings ratio measures how much investors are willing to pay for each dollar of a company’s earnings, calculated by dividing the stock price by earnings per share.
How Do You Calculate the Price to Earnings Ratio?
Short answer: Divide the current stock price by earnings per share (EPS).
The standard formula looks like this:
P/E Ratio = Share Price ÷ Earnings Per Share
For example, if a stock trades at $100 and the company earned $5 per share over the last year, the P/E ratio is 20. That means investors are paying $20 for every $1 of earnings.
What Earnings Are Used in the Calculation?
This is where many investors get confused. There are two main versions:
- Trailing P/E: Uses earnings from the last 12 months (TTM). This is based on actual reported profits.
- Forward P/E: Uses estimated earnings for the next 12 months. This depends on analyst forecasts.
Trailing P/E is more reliable because it uses real data. Forward P/E can be useful, but only if the estimates are realistic.
Case Example: Simple Calculation
Let’s look at a real-world style example:
| Metric | Value |
|---|---|
| Stock Price | $150 |
| Earnings Per Share (TTM) | $6 |
| P/E Ratio | 25 |
This stock trades at 25 times earnings. On its own, that number means nothing. Context is what makes it useful.
What Does the P/E Ratio Actually Tell You?
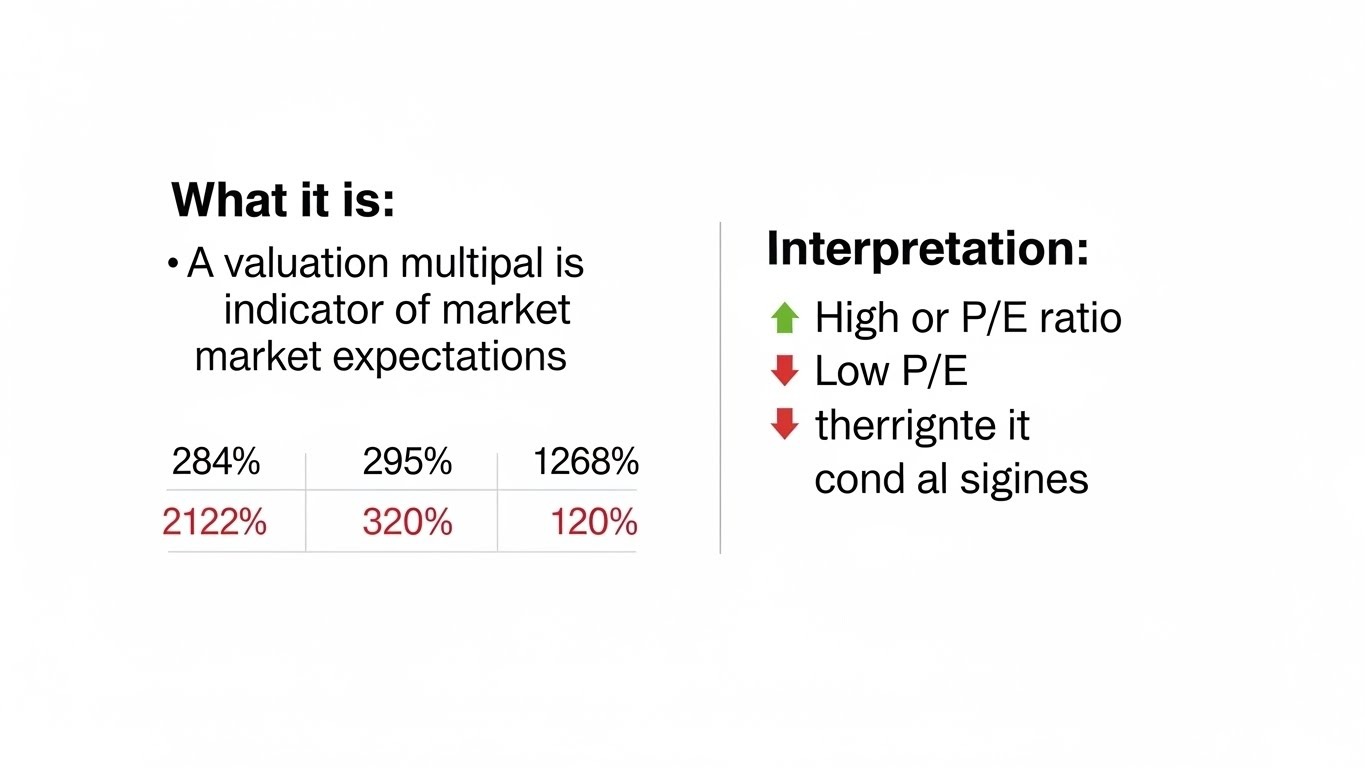
Short answer: The P/E ratio reflects market expectations about growth, risk, and future earnings.
A high P/E ratio usually signals that investors expect strong future growth. A low P/E ratio may indicate slower growth, higher risk, or undervaluation.
High P/E Ratio Explained
Companies with high P/E ratios often share these traits:
- Rapid revenue or earnings growth
- Strong brand or competitive advantage
- Investor confidence in future profits
For example, growth-focused technology companies often trade at higher P/E multiples because investors expect earnings to expand over time.
Low P/E Ratio Explained
A low P/E ratio can mean:
- The company is undervalued
- The business faces declining earnings
- The industry is under pressure
Low does not automatically mean “cheap.” It often reflects risk that the market has already priced in.
How Should You Compare P/E Ratios Correctly?
Short answer: Always compare P/E ratios within the same industry and time frame.
Comparing a bank’s P/E ratio to a software company’s P/E ratio is misleading. Different industries grow at different speeds and carry different risks.
Industry-Based Comparison
Here’s a simplified illustration:
| Sector | Typical P/E Range |
|---|---|
| Technology | 20–35 |
| Consumer Staples | 15–25 |
| Banking | 8–15 |
| Utilities | 10–18 |
This shows why “high” or “low” P/E ratios only make sense in context.
Historical Comparison
Another effective approach is comparing a company’s current P/E ratio to its own past averages. If a stock usually trades at 15 times earnings but is now at 25, investors should ask why.
Can You Use the Price to Earnings Ratio for Real Market Decisions?
Short answer: Yes, but only as part of a broader analysis.
Let’s look at a realistic market-style case study.
Case Study: Growth vs Value Stock
Assume two companies:
| Company | P/E Ratio | Earnings Growth |
|---|---|---|
| Company A | 30 | 20% annually |
| Company B | 10 | 3% annually |
Company A looks expensive at first glance. Company B looks cheap. But when you factor in growth, Company A may justify its higher valuation.
This is why experienced investors rarely use the P/E ratio in isolation.
What Are the Biggest Limitations of the P/E Ratio?
Short answer: The P/E ratio breaks down when earnings are unstable or negative.
Negative Earnings
If a company has negative earnings, the P/E ratio becomes meaningless. You cannot divide by a negative or zero value in a way that helps valuation.
Accounting Distortions
Earnings can be affected by one-time charges, asset sales, or accounting changes. This can distort the P/E ratio and make a stock appear cheaper or more expensive than it really is.
Ignores Debt
The P/E ratio does not account for debt levels. Two companies with the same P/E ratio may have very different risk profiles if one carries heavy debt.
How Do Professional Investors Improve on the P/E Ratio?
Short answer: They combine it with other valuation metrics.
- PEG Ratio: Adjusts P/E for growth
- EV/EBITDA: Accounts for debt and cash
- Price-to-Book: Useful for asset-heavy industries
Professionals use the P/E ratio as a starting point, not a final decision tool.
Conclusion: How Should You Use the Price to Earnings Ratio Going Forward?
The price to earnings ratio remains one of the most powerful tools in stock analysis when used correctly. It helps investors quickly gauge market expectations, compare companies within the same industry, and spot valuation extremes.
But the real edge comes from understanding its limits. The P/E ratio does not predict stock prices on its own. It does not replace cash flow analysis, balance sheet strength, or growth outlook.
If you’re serious about investing, use the P/E ratio as your first filter, not your final verdict. Combine it with growth trends, industry context, and financial health.
Call to Action: If you want smarter investing decisions, start tracking P/E ratios across sectors and pair them with growth metrics. Bookmark this guide and apply it the next time you analyze a stock.
Frequently Asked Questions About Price to Earnings Ratio
What is a good price to earnings ratio?
A good P/E ratio depends on the industry. Technology stocks often trade at higher P/E ratios, while banks and utilities usually trade lower.
Is a lower P/E ratio always better?
No. A low P/E ratio can signal undervaluation or indicate weak growth and higher risk.
What does a negative P/E ratio mean?
A negative P/E ratio means the company has negative earnings, making the metric unreliable.
Should beginners rely on the P/E ratio?
Beginners can use it as a starting point, but should not rely on it alone when making investment decisions.
What is the difference between trailing and forward P/E?
Trailing P/E uses past earnings, while forward P/E uses projected future earnings.
Does the P/E ratio work for all stocks?
No. It works best for profitable, stable companies and poorly for early-stage or loss-making firms.
Related Topics: Four Essentials for Every DIY Painter And Decorator
Related Topics: 5 reasons to visit the Cotswolds


